Research Sites
Three study sites were selected in the mixedwood boreal forest of east-central Alberta (Figure 8). These sites are approximately 30 kilometres northeast of Lac La Biche (Figure 9) on land managed by Alberta-Pacific Forest Industries.
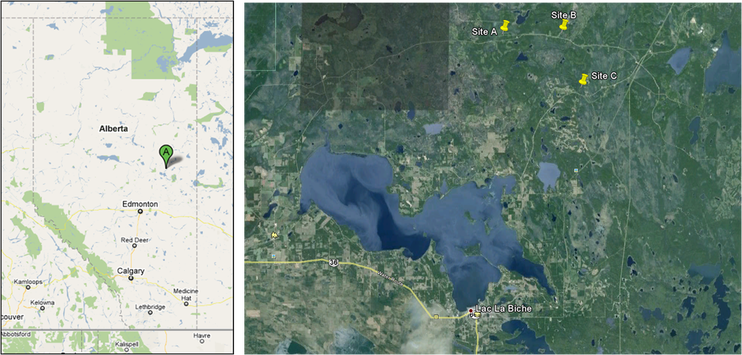
Figure 8.Region map. (Image: Google Figure 9. Local study area near Lac La Biche, Alberta. Sites A, B, and C lie to the
Maps) northwest of Lac La Biche. (Image: Google Earth)
Maps) northwest of Lac La Biche. (Image: Google Earth)
Experimental Design/Vegetation Sampling
Experiment Design
Blocks A, B, and C (Figure 9) were harvested in winter 2001 and planted in spring 2002 with white spruce. Radial brushing treatments [ 1, 1.5, 2, and 2.5 metres] were then randomly applied to each cutblock at 2, 4, and 6 years after stand establishment (Figure 11). Sampled spruce were selected on a 6-metre spacing to assure sample independence (Figures 10-11). In total, 241 trees were sampled across three sites under thirteen treatments [(4 treatment radii x 3 brushing years) + (Untreated Control)] (Figure 11). Overall, the experimental design attempted to test spruce growth against treatment radius and treatment timing (Figure 11).
Vegetation Measurements
All measurements were sampled in June of 2010. Spruce height, leader length, and ground line diameter were measured using a graduated height pole and a diameter tape. Competition was sampled within a 1.78 metre radius [1/1000 hectare plot] of each crop tree. Specifically, foliar cover was visually estimated according to competition growth form: herbs, shrubs, grasses, and trees [aspen]. Moreover, the modal height of each growth form was assessed using the graduated height pole. Finally, the horizontal distance to competing aspen was determined using a measuring tape; these measures were taken in each cardinal direction [north, south, east, and west], indicating the spatial distribution of aspen competition.
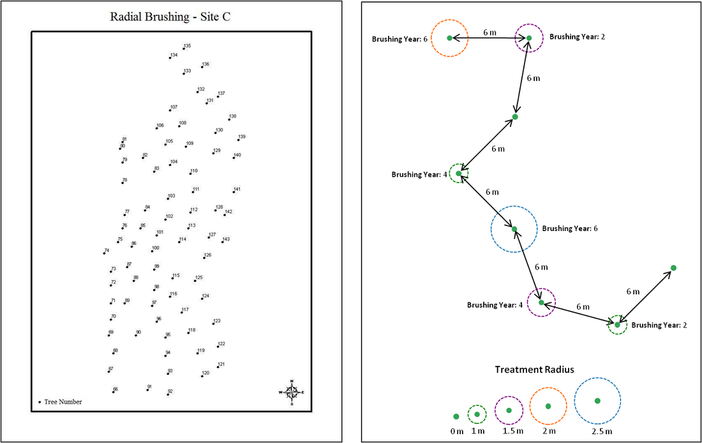
Figure 10. Plot layout at research site "C". Spruce were Figure 11. Hypothetical plot layout and treatment scheme.
selected randomly throughout the block. (Image: Susan Four radial brushing treatment radii [ 1, 1.5, 2, and 2.5
Humphries) metres] were randomly applied in three treatment years
after spruce establishment [Years 2, 4, and 6]. Sampled
trees were spaced at 6-metres to assure sample
independence. Control trees [0m] are represented by a
single green dot.
Analysis Methods
Statistical and graphical analysis was conducted in the "R" statistics package. Given a [relatively] small dataset, data management and basic computation occurred in Microsoft Excel, prior to importation into "R".
Statistical Analysis
Non-normal datasets precluded the use of parametric statistics. [See the "Results" section.] In addition, treatment design also restricted non-parametric testing. For example, an unbalanced experimental design excluded a permutational ANOVA under the "Permanova6" Fortran program. Univariate dependent variables also prohibited a permutational ANOVA under the "R" vegan package. Finally, treatment replicates ruled out a Friedman Rank Test.
Ultimately, a series of Kruskal-Wallis tests were performed on each dependent variable by site and treatment. Specifically, the Kruskal-Wallis test allows multiple treatment levels to be analyzed simultaneously [e.g. five treatment radii]; nevertheless, this test could not handle the experiment's multi-factor treatment design or test for treatment interactions. Significant Kruskal-Wallis results were followed by paired Wilcoxon Rank Sum Testing.
Competition Analysis
For the final analysis, five competition indices were tested against spruce height (Figure 12). Each index characterized plant competition by foliar cover, competition height, crop tree height, and/or the distance to competition (Figure 12). Given strong predictive power in Cortini and Comeau (2008), Foliar cover, "Foliar cover x Modal Height", Comeau Index, View Angle Index, and Modified Braathe Index were selected for this experiment. [Cortini and Comeau (2008) achieved R² values >0.77 when correlating these competition indices with white spruce growth.]
Given non-normal variables, spruce height was related to each competiton index via Kendall non-parametric correlations.
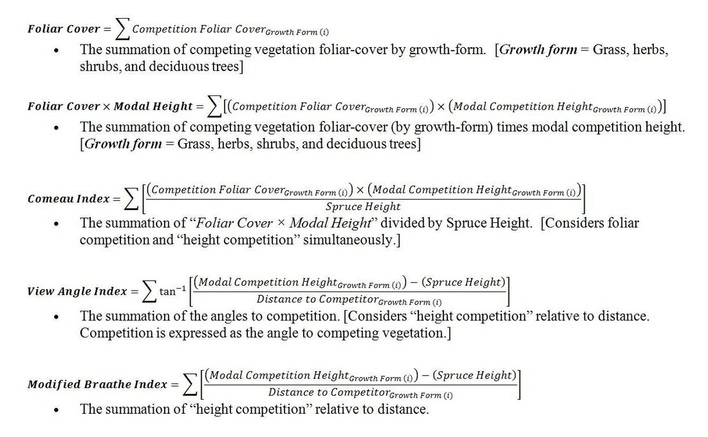
Figure 12. Five competition indices that yielded the "best" relationship with spruce growth in Cortini and Comeau (2008).
The equation and summary of each index is included in this graphic.
The equation and summary of each index is included in this graphic.
Data Table
For analysis, the independent variables included treatment radius [Treat_RAD] and treatment year [Treat_YR] (Table 1). Alternately, the dependent variables reflect conifer growth response: spruce diameter [D15], height [Height], and leader length [Leader] (Table 1). For normality testing, square root transformations of spruce diameter [DIA_SQRT], height [HT_SQRT], and leader length [LDR_SQRT] were also appended to the table (Table 1). Competition indices occupy the last five columns of data: Foliar Cover [VC_SUM], "Foliar Cover x Modal Height" Index [VCHT_SUM], Comeau Index [CI_SUM], View Angle Index [VI_AVE], and Modified Braathe Index [MBA_SUM] (Table 1; Figure 12).
Table 1. Sample data table. "Treat_YR" (Treatment Year) and "Treat_RAD" (Treatment Radius) are the independent variables. "D15"
(Spruce Diameter at 15 cm), "Height" (Spruce Height), and "Leader" (Spruce Leader Length) are the dependent variables testing conifer
growth response. "D15" is in millimetres, "Height" is in centimetres, and "Leader" is in centimetres. For the final analysis, five competition
indices (Figure 12) were tested against spruce growth: "VC_SUM" (Foliar Cover), "VCHT_SUM" (Foliar Cover x Modal Height", "CI_SUM"
(Comeau Index), "VI_AVE" (View Angle Index), and "MBA_SUM" (Modified Braathe Index).

