Data Distribution and Treatment
When analyzing spruce growth distributions relative to treatment radius and brushing year, no consistent trends are visually apparent (Figure 13). In instances where slight trends do appear, other sites, brushing age classes, or treatment radii provide contradictory results. For example, on Site "C", spruce diameter increases with treatment radius in the year-2 brushing treatment; however, no consistent diameter-distribution trends occur in the year-2 treatments on Sites "A" or "B" (Figure 13). In addition, spruce leader-length distributions decrease relative to treatment radius in the year-2 brushing treatment on Site "B", contradicting the hypothesis (Figure 13).
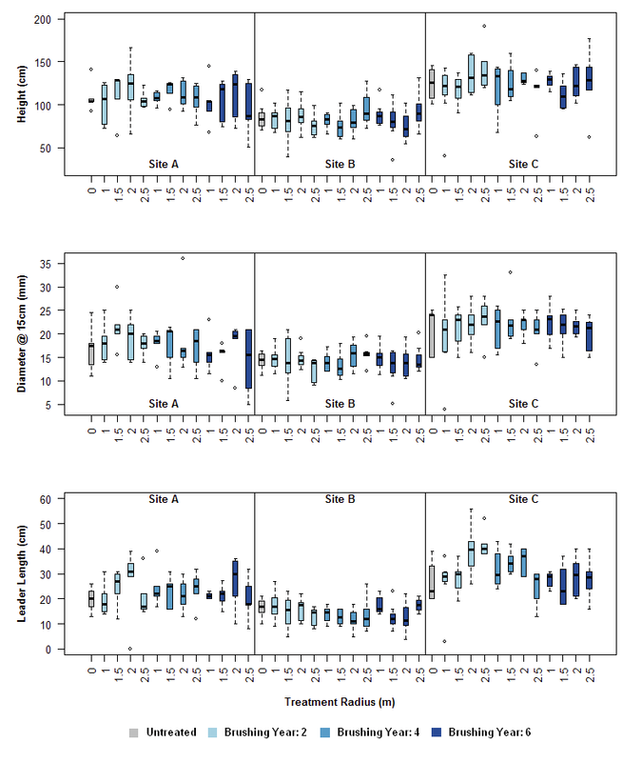
Figure 13. Boxplot of height, diameter, and leader length data distributions relative to site, treatment radius, and
brushing year. The "stepped" blue colour sequence indicates brushing year. No consistent trends are visible.
For every hypothesis supporting trend of the response variable, adjacent sites frequently contradict the hypothesis
[i.e. no treatment response] or provide confounding results [e.g. larger treatment radii have low-to-moderate growth.]
Data Mean and Treatment
When analyzing mean spruce growth relative to treatment radius and brushing year, no consistent trends are visible (Figure 14). For example, mean spruce height increases with treatment radius in the year-2 brushing treatment on Site "C"; however, no discernible mean-height trend occurs in the year-2 treatment on Site "B" (Figure 14). Alternately, the mean-height trend in the year-2 treatment on Site "A" appears somewhat parabolic (Figure 13).
When considering standard error, most confidence intervals overlap with adjacent treatment means, suggesting "no significant difference" between brushing treatments. For example, most mean diameters on Site "A" fall within the confidence interval of the untreated control (Figure 14).
When considering standard error, most confidence intervals overlap with adjacent treatment means, suggesting "no significant difference" between brushing treatments. For example, most mean diameters on Site "A" fall within the confidence interval of the untreated control (Figure 14).
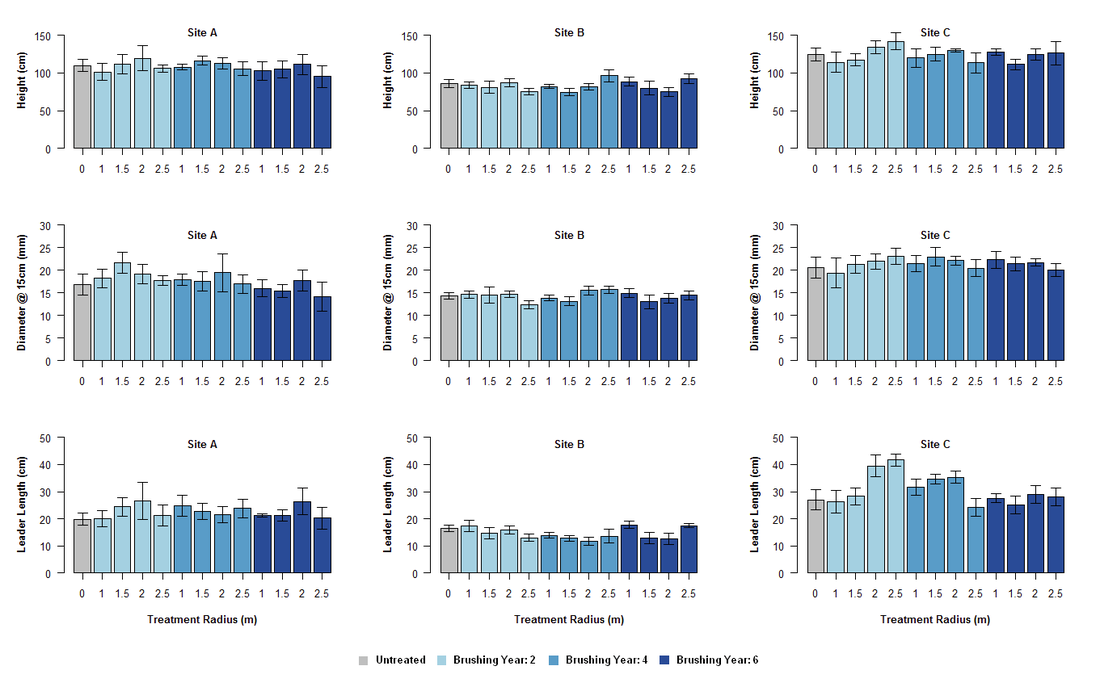
Figure 14. Barplot of mean height, diameter, and leader length relative to site, treatment radius, and brushing year.
Error bars represent standard error. The "stepped" blue colour sequence also indicates brushing year. No
consistent trends are visible; most confidence intervals overlap the mean(s) of adjacent treatments. Moreover, for
every hypothesis-supporting trend of the response variable, adjacent sites frequently contradict the hypothesis
[i.e. no treatment response] or provide confounding results [e.g. larger treatment radii have low-to-moderate growth.]
Data Normality
Dataset normality was tested using the Shapiro-Wilk Test and histogram graphics (Table 2, Figure 15). Ultimately, neither the control nor the transformed datasets achieved normality (Table 2). Graphically, bimodal and skewed distributions dominated, even in the "most normal" square root transformations (Figure 14; Table 2).
Table 2. Summary of Shapiro-Wilk testing on square root, logarithmic, and inverse transformations
of spruce height, diameter, and leader length. Under a standard p-value of 0.05, no transformation
yielded a normal distribution with the radial brushing data.
of spruce height, diameter, and leader length. Under a standard p-value of 0.05, no transformation
yielded a normal distribution with the radial brushing data.
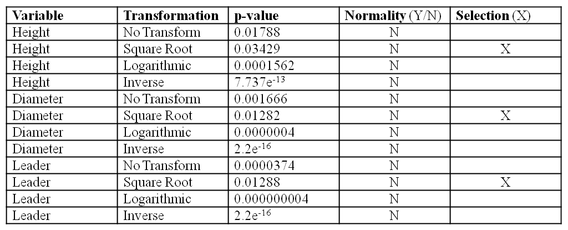
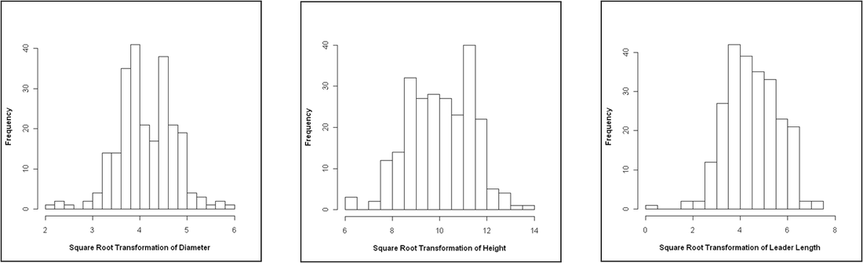
Figure 15. Examples of non-normality after a square root transformation of diameter, height, and leader length in the intimate mixture dataset. Note:
Square root transformations yielded the best p-values after the Shapiro-Wilk testing in Table 2. Bimodal and skewed distributions dominate.
Square root transformations yielded the best p-values after the Shapiro-Wilk testing in Table 2. Bimodal and skewed distributions dominate.
Treatment Significance
Overall, brushing year and treatment radius did not significantly influence spruce growth. After testing each site, growth, and treatment combination, only one significant relationship was found (Table 3). This relationship was restricted to Site C and suggested that spruce leader-length was influenced by brushing year (Table 3). Paired Wilcoxon Rank Sum tests confirmed Kruskal-Wallis testing; however, only one treatment combination significantly influenced spruce growth (Tables 3-4). In this case, an earlier brushing treatment did increase leader length (Table 4). Overall, finding statistical significance on one site, under one treatment combination, and using only one treatment variable does not truly "support" the hypothesis.
Table 3. Series of Kruskal-Wallis tests by site, dependent variable, and independent
variable. Significance is denoted by an "X". Only one significant treatment effect was
observed.
variable. Significance is denoted by an "X". Only one significant treatment effect was
observed.
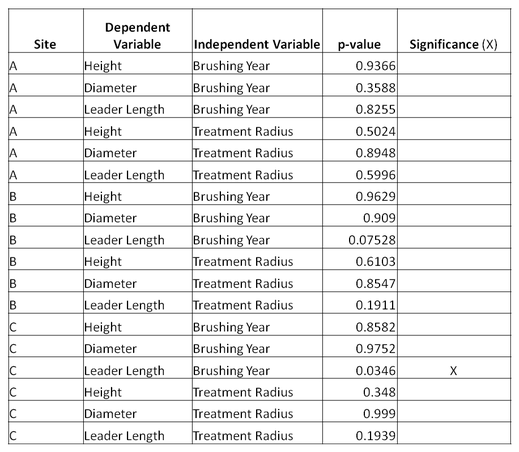
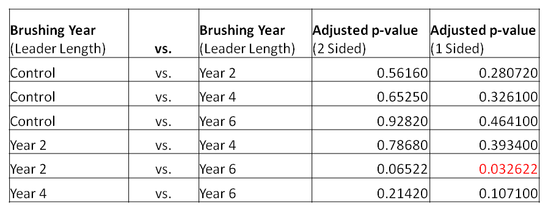
Table 4. Panel of paired Wilcoxon Rank Sum Tests for the significant relationship in Table 3.
Significance is denoted in red. P-values are transformed using Holm's adjustment for multiple
paired comparisons. On one-sided tests, the untreated control OR earlier brushing year
treatment(s) were expected to exhibit increased spruce growth. Brushing year significantly
influenced leader length between years two and six.
Competing Vegetation and Spruce Growth
Across all treatment sites, spruce height was weakly correlated with vegetative competition. No correlation value exceeded -0.391 (Figures 16-18); moreover, less than half of these correlations were statistically significant (Figures 16-18). Excluding "Foliar Cover x Modal Height" on Site A, significant correlations did support the second hypothesis, indicating reduced spruce growth with increasing competition (Figures 16-18). Overall, the relationship between spruce height and competing vegetation is inconsistent, contradictory, and somewhat confusing.
Visually, most height/competition relationships appear noisy with weak linear trends (Figures 16-18).
Visually, most height/competition relationships appear noisy with weak linear trends (Figures 16-18).
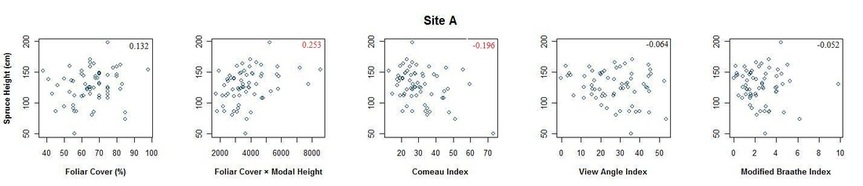
Figure 16. Spruce height relative to five vegetation indices on Site A. The Kendall non-parametric correlation of each relationship is listed in the upper
right corner of each graph. Significant relationships [α > 0.05] are listed in red.
right corner of each graph. Significant relationships [α > 0.05] are listed in red.
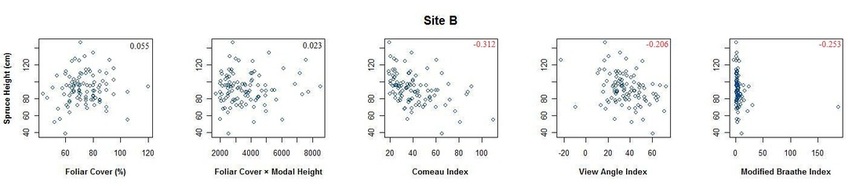
Figure 17. Spruce height relative to five vegetation indices on Site B. The Kendall non-parametric correlation of each relationship is listed in the upper
right corner of each graph. Significant relationships [α > 0.05] are listed in red.
right corner of each graph. Significant relationships [α > 0.05] are listed in red.
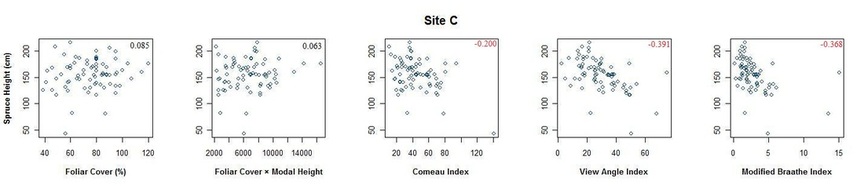
Figure 18. Spruce height relative to five vegetation indices on Site C. The Kendall non-parametric correlation of each relationship is listed in the upper
right corner of each graph. Significant relationships [α > 0.05] are listed in red.
right corner of each graph. Significant relationships [α > 0.05] are listed in red.
